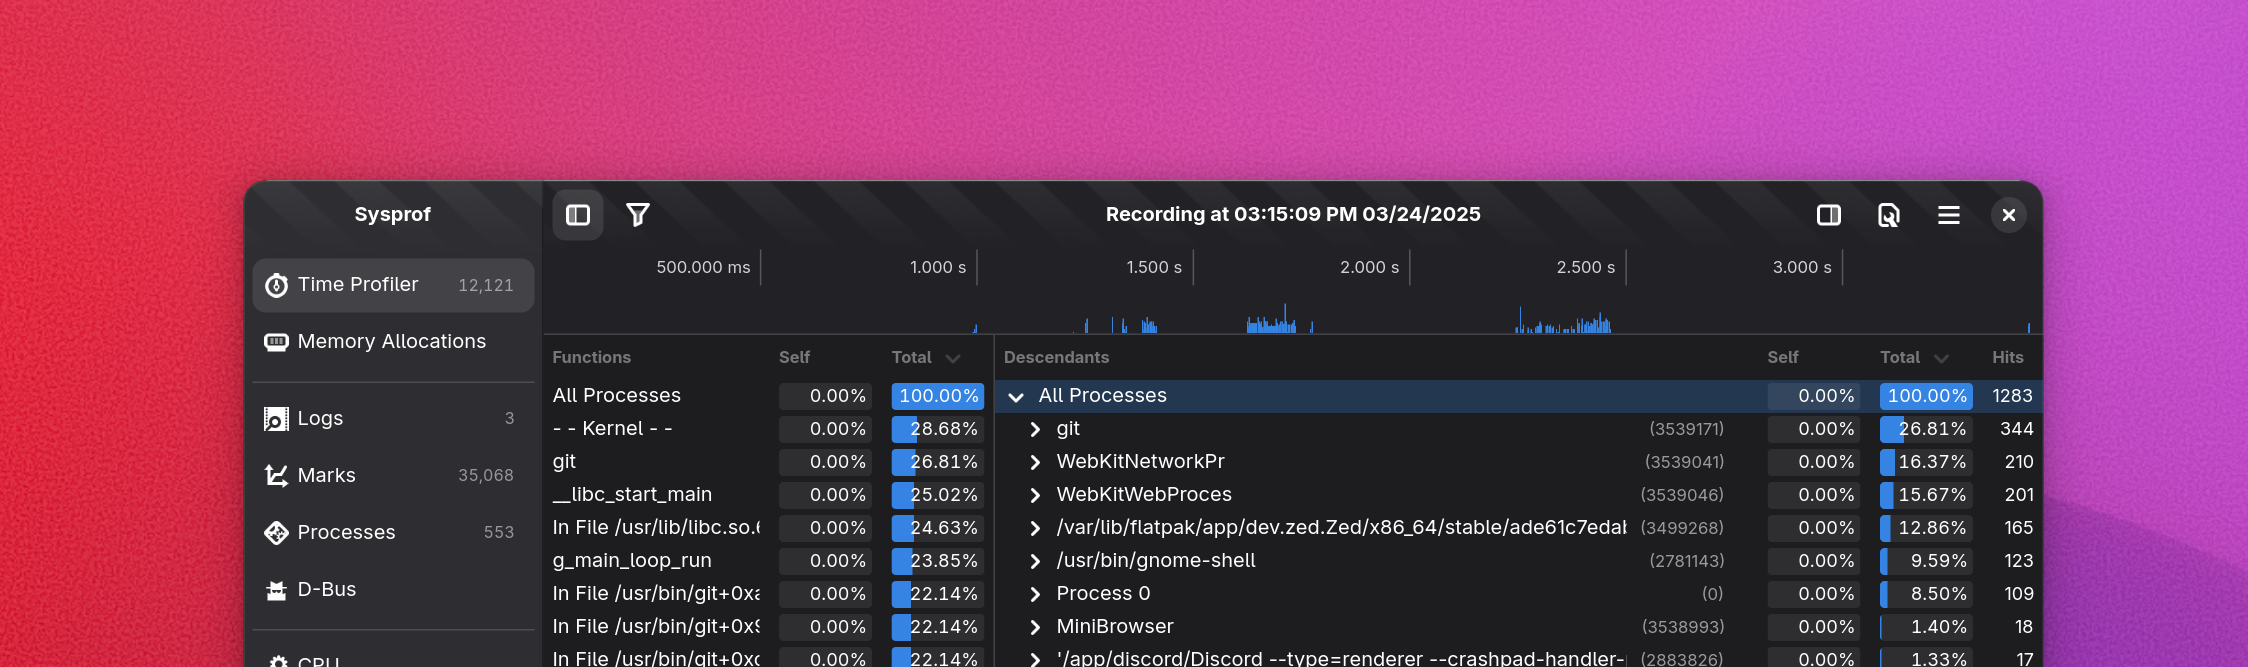
I’ve blogged in the past about how WebKit on Linux integrates with Sysprof, and provides a number of marks on various metrics. At the time that was a pretty big leap in WebKit development since it gave use a number of new insights, and enabled various performance optimizations to land.
But over time we started to notice some limitations in Sysprof. We now have tons of data being collected (yay!) but some types of data analysis were pretty difficult yet. In particular, it was difficult to answer questions like “why does render times increased after 3 seconds?” or “what is the CPU doing during layout?”
In order to answer these questions, I’ve introduced a new feature in Sysprof: filtering by marks.
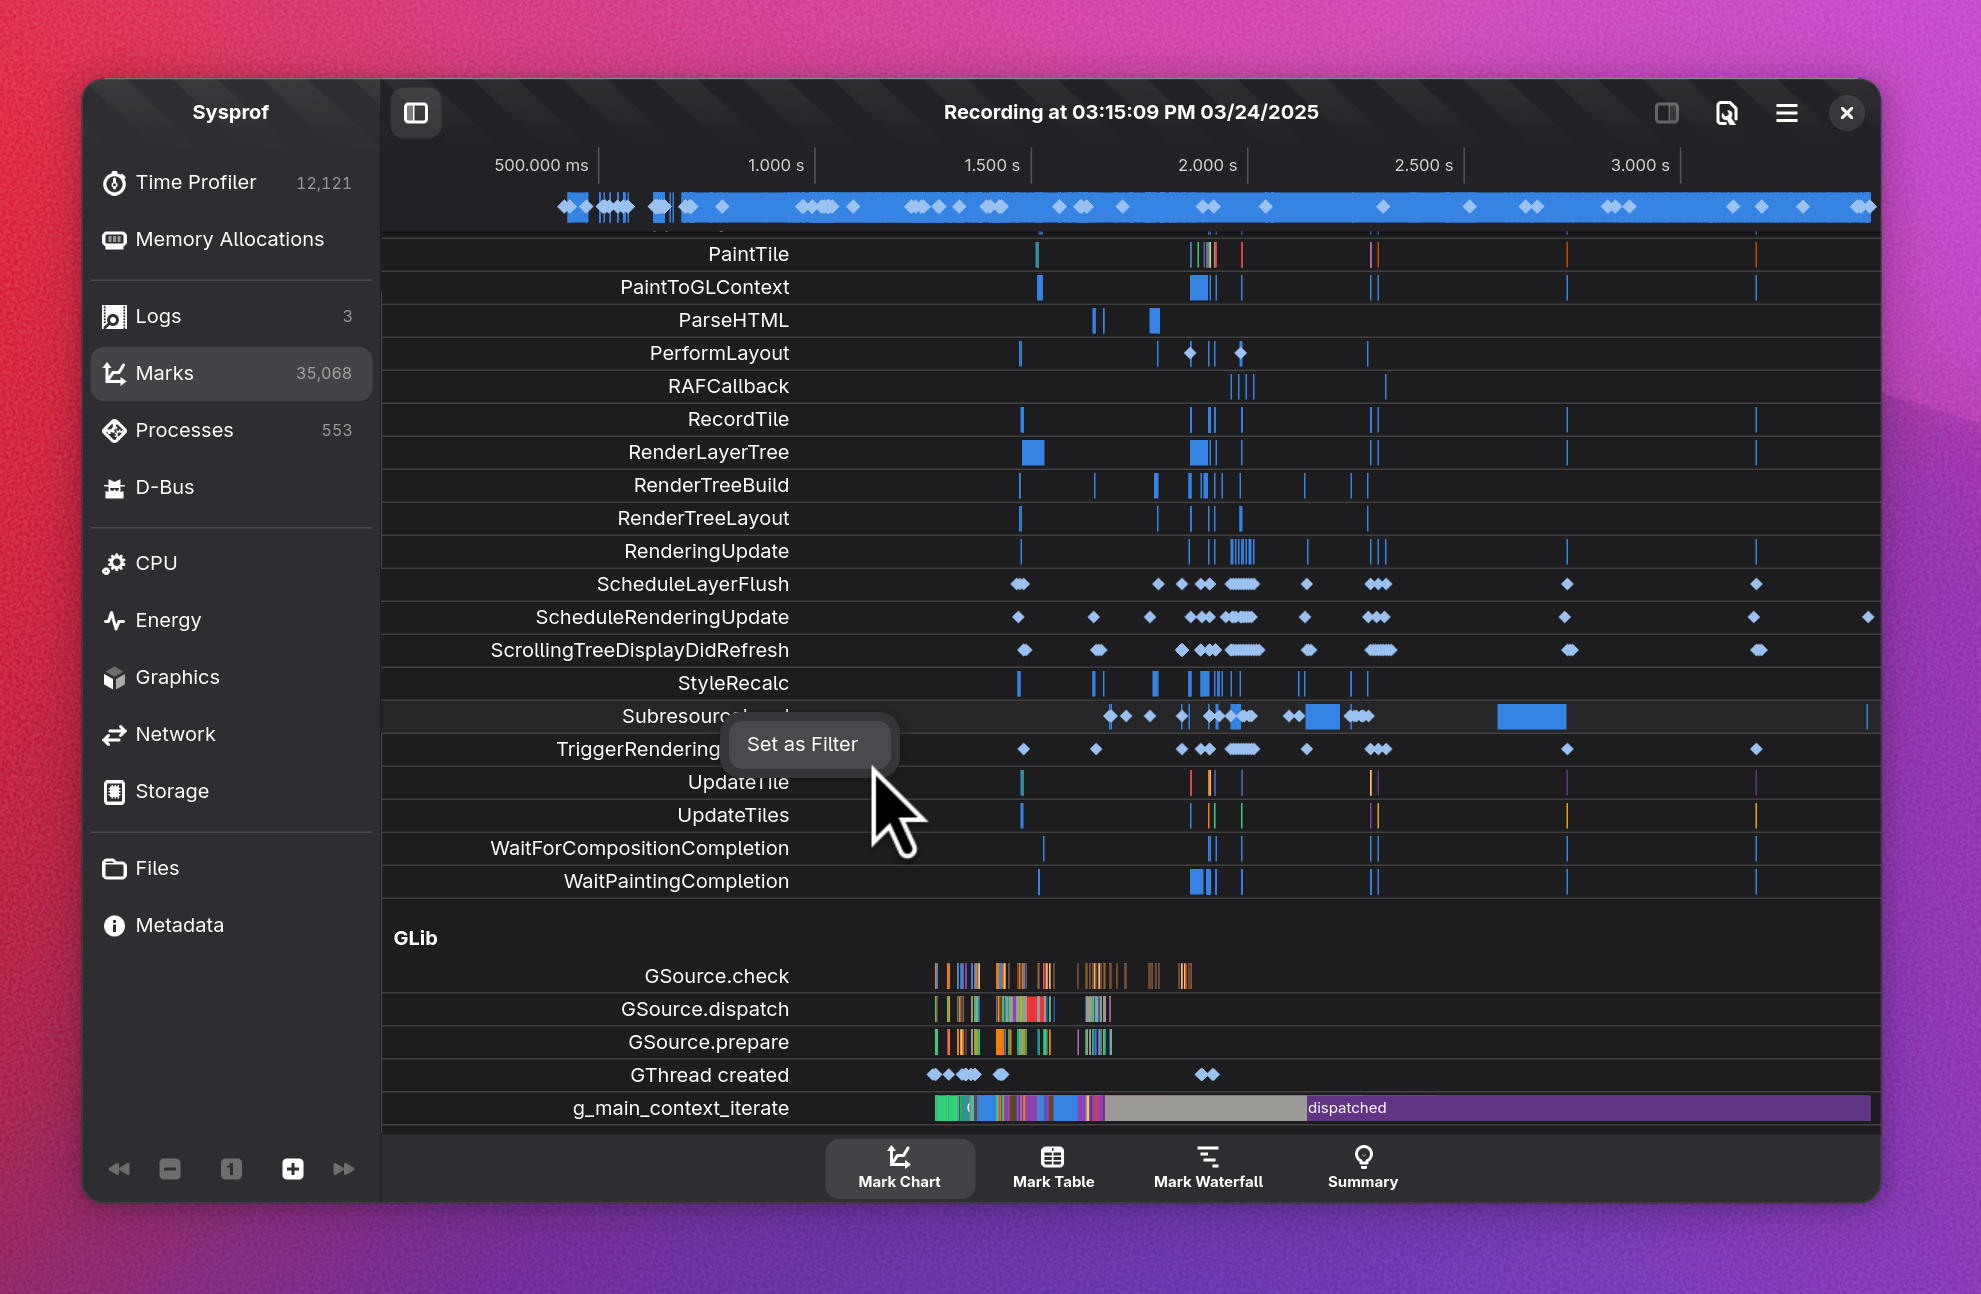
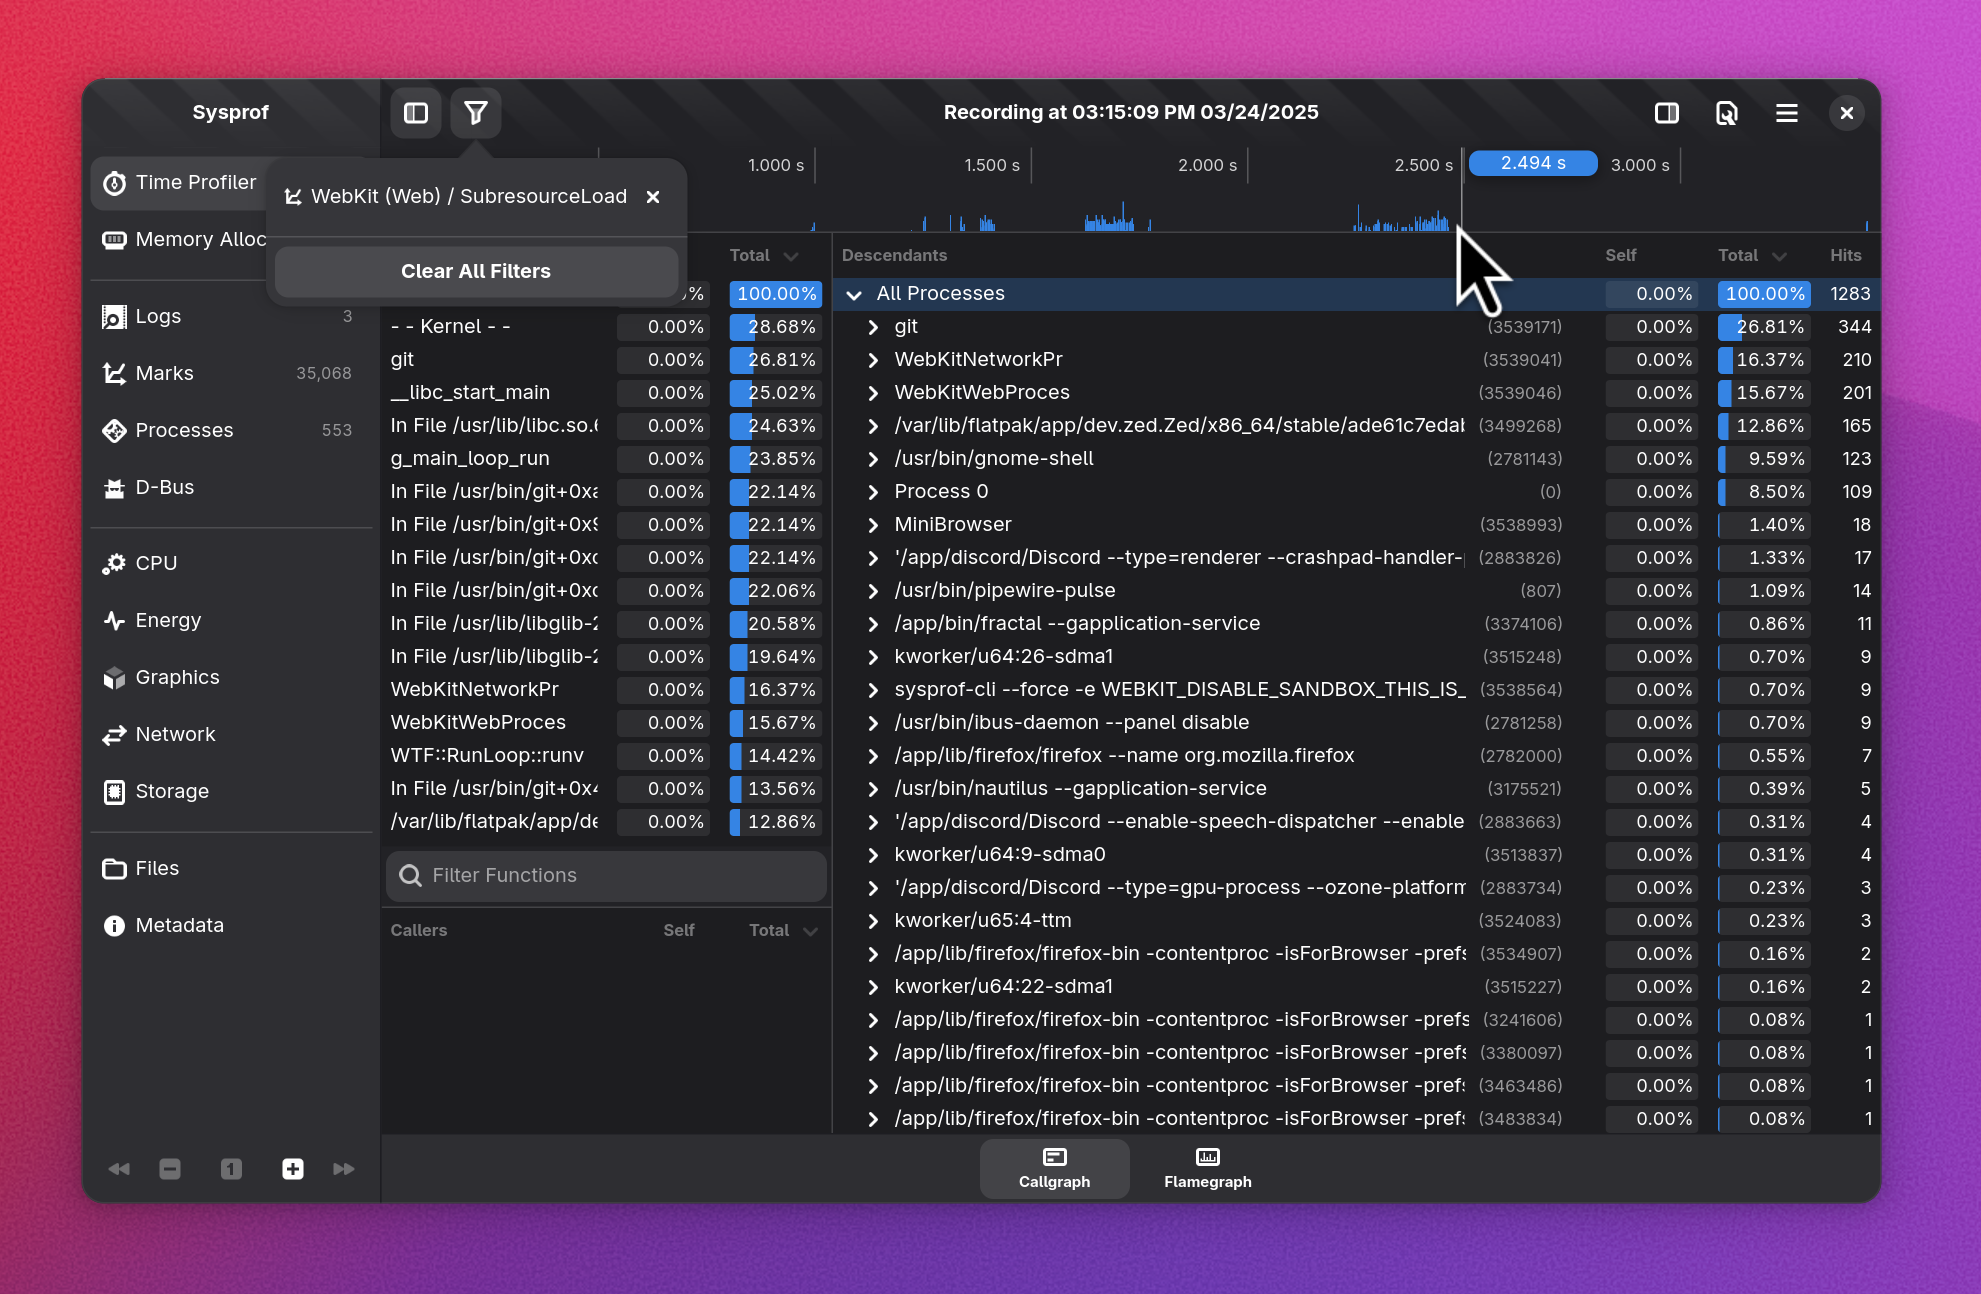
Hopefully people can use this new feature to provide developers with more insightful profiling data! For example if you spot a slowdown in GNOME Shell, you open Sysprof, profile your whole system, and filter by the relevant Mutter marks to demonstrate what’s happening there.
Here’s a fancier video (with music) demonstrating the new feature:
Enjoy!
Leave a Reply