Over the past few months, the Endless OS Foundation has been putting focus on improving GNOME Software’s reliability and performance. Endless OS is an OSTree-based immutable OS, and applications are entirely distributed as Flatpaks. GNOME Software is the frontend to that, and since our target userbase is definitely not going to use a terminal, we need to make sure GNOME Software delivers a good experience.
This focus has been materializing with Philip’s long effort to switch GNOME Software to a different threading model, more suitable to what Software does these days; and more recently, I’ve been tasked to look at GNOME Software’s performance from a profiling perspective.
Profile, Profile, Profile
I’ve been looking at performance-related tasks for many years now. It’s a topic of investigation that I personally enjoy, even if it’s a bit annoying and frustrating at times. My first real, big performance investigation was some good six years ago, on GNOME Music. Back then, the strategy to profiling was: guess what’s wrong, change that, see if it works. Not exactly a robust strategy. Luckily, it worked for that particular case.
Then over the next year I started to contribute to Mutter and GNOME Shell, and one of my first bigger performance-related investigations in this area involved frame timings, GJS, and some other complicated stuff. That one was a tad bit more complicated, and it still relied on gut feelings, but luckily some good improvements came out of that too.
Those two instances of gut-based profiling are successful when put like this, but that’s just a trick with words. Those two efforts were successful due to a mix of ungodly amounts of human effort, and luck. I say this because just a few months after, the GNOME Performance Hackfest took place in Cambridge, UK, and that was the beginning of a massive tsunami that took the GNOME community.
This tsunami is called profiling.
In that hackfest, Christian and Jonas started working on integrating Sysprof and Mutter / GNOME Shell. Sysprof was already able to collect function calls without any assistance, but this integration work enabled, for example, measuring where in the paint routines was GNOME Shell taking time to render. Of course, we could have printed timestamps in the console and parsed that, but let’s be honest, that sucks. Visualizing data makes the whole process so much easier.
So much easier that even a fool like myself could contribute. After quickly picking up the work where Jonas left, GNOME Shell was able to produce profiling data like below:

That integration, alone, allowed us to abandon the Old Ways of profiling, and jump head first into a new era of data-based optimizations. Just looking at the data above, without even looking at function calls, we can extract a lot of information. We can see that the layout phase was taking 4ms, painting was taking 5ms, picking was taking ~2ms, and the whole process was taking ~12ms. Looking at this data in depth is what allowed, for example, reducing pick times by 92%, and rendering times by a considerable factor too.
The most important lesson I could derive from that is: optimizing is borderline useless if not backed by profiling data. Always profile your app, and only optimize based on profiling data. Even when you think you know which specific part of your system is problematic, profile that first, just to confirm.
With these lessons learned, of course, I used this approach to profile GNOME Software.
Profiling an App Store
Naturally, the problem domain that GNOME Software – an app store – operates into is vastly different from that of GNOME Shell – a compositor. GNOME Software is also in the middle of a major transition to a new threading model, and that adds to the challenge of profiling and optimizing it. How do you optimize something that’s about to receive profound changes?
Fortunately for us, GNOME Software already had a basic level of integration with Sysprof, which gave some introspection on how it was spending its time, but not enough. My initial reaction was to extend this Sysprof integration and cover more events, in a more hierarchical manner. The goal was to improve whatever was making navigation through categories slow.
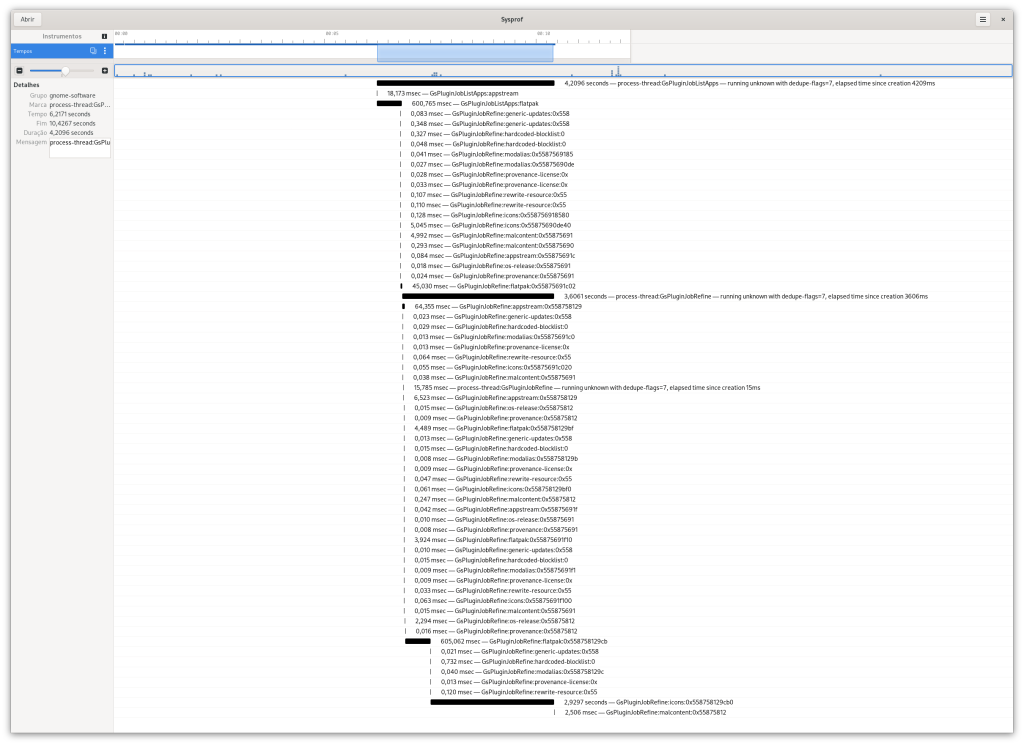
This proved to be a successful strategy. Here’s what profiling GNOME Software gave us:

Zoom in in the image. Take a few seconds to analyse it. Can you spot where the issue is?
If not, let’s do this together.
This slice of profiling shows that the GsPluginJobListApps operation (first line) took 4 whole seconds to execute. That’s a long time! This operation is executed to list the apps of a particular category. This means people have to wait 4 entire seconds, just to see the apps of a category. Certainly a usability killer, exploring these apps is supposed to be fun and quick, and this issue hurts that.
You may notice that there are other sub-events beneath GsPluginJobListApps. The first line is the timing of the whole operation, and beneath that, we have the timings of each individual sub-operation it does to end up with a list of apps.
Skimming through the entire profiler window, the widest black bars beneath the first line are, in order of appearance:
GsPluginJobListApps:flatpaktaking 600msGsPluginJobRefinetaking 3.6 secondsGsPluginJobRefine:flatpaktaking 600msGsPluginJobRefine:iconstaking about 3 seconds
What that tells us is that the GsPluginJobListApps operation runs a GsPluginJobRefine sub-operation, and the icons are what’s taking most of the time there. Icons!
Refining is GNOME Software terminology for gathering metadata about a certain app, such as the name of the author, origin of the application, description, screenshots, icons, etc.
Icons!
Contrary to all my expectations, what was clear in these profiling sessions is that loading icons was the worst offender to GNOME Software’s performance when navigating through categories. This required further investigation, since there’s a fair bit of code to make icon management fast and tight on memory.
It didn’t take long to figure out what was happening.
Some applications declare remote icons in their metadata, and GNOME Software needs to download these icons. Turns out, in Flathub, there are a couple of apps that declare such remote icons, but the icons don’t actually exist in the URL they point to! Uh oh. Obviously these apps need to fix their metadata, but we can’t let that make GNOME Software slow to a crawl.
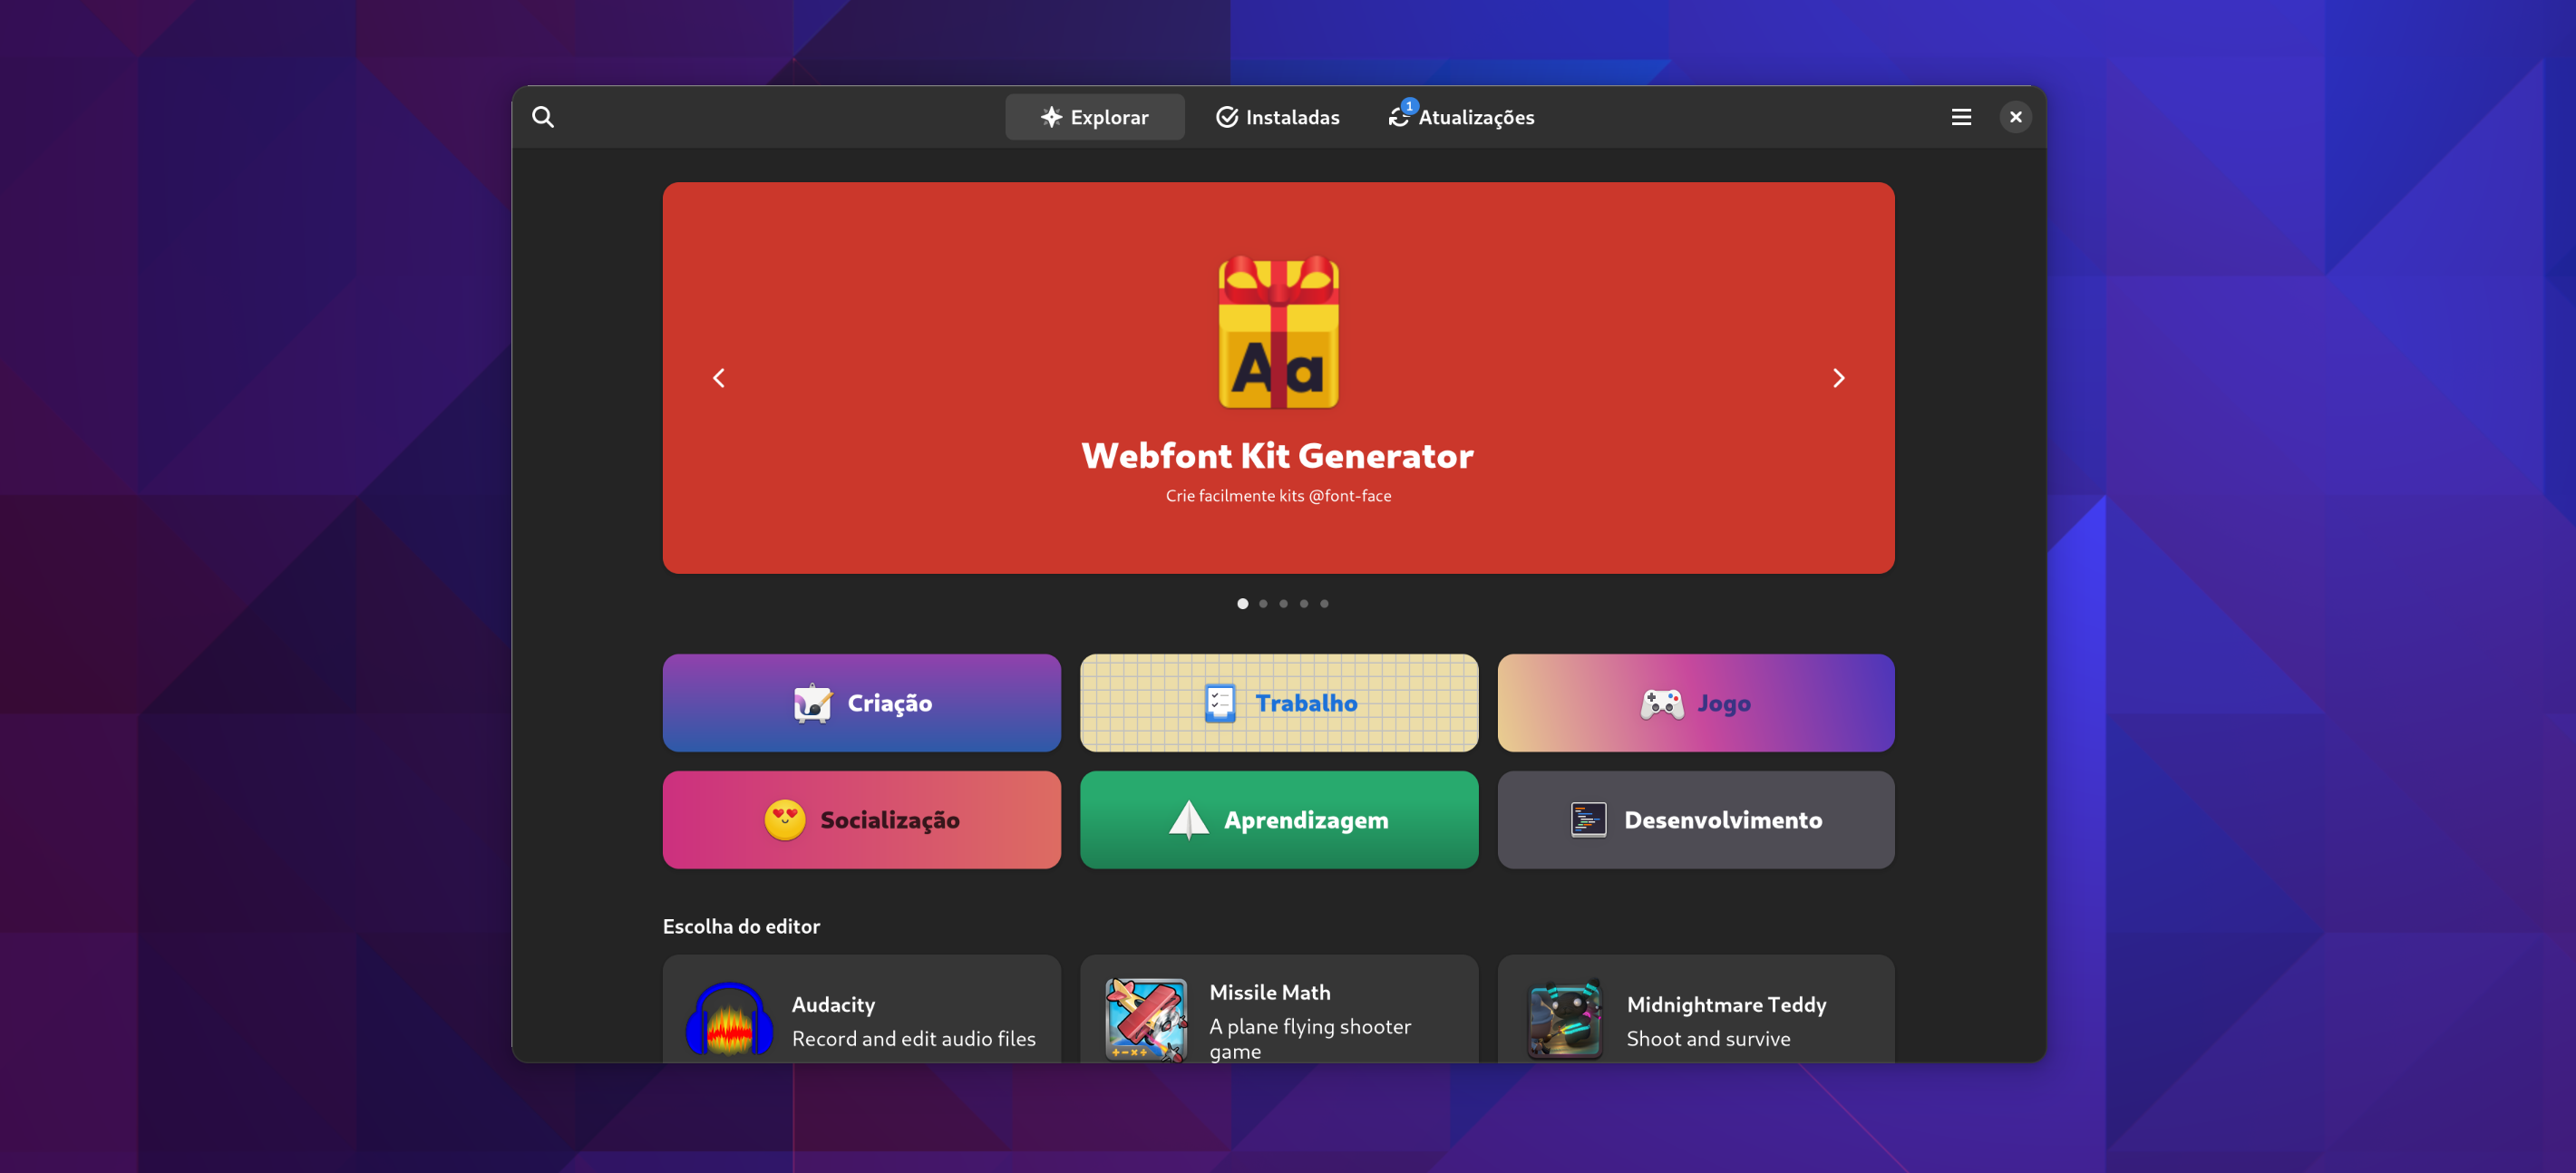
Knowing exactly what was the problem, it wasn’t difficult to come up with potential solutions. We always have to download and cache app icons, but we can’t let that block loading categories, so the simplest solution is to queue all these downloads and continue loading the categories. The difference is quite noticeable when comparing with the current state:
Most of the time, GNOME Software already has access to a local icon, or a previously downloaded and cached icon, so in practice it’s hard to see them downloading.
Final Thoughts
I hope to have convinced you, the reader, that profiling your application is an important step when working on optimization. This article is focused on the timing marks, since they’re the easiest to understand on a quick glance, but these marks have little meaning when not accompanied with the function calls stack. There’s a lot to unpack on the subject, and sometimes this feels more like an art than simply a mechanical evaluation of numbers, but it sure it a fun activity.
Sadly, until very recently, even profiling was still a major pain – although much less painful than guess-based profiling – since you’d need to build at least your app and some of its dependencies with debug symbols to get a meaningful call stack. Most of the profiling I’ve mentioned above required building all dependencies up to GLib with debug symbols.
However, seems like a game changing decision has been made by the Fedora community to finally enable frame pointers on their packages by default. And that means that the setup overhead to perform profiling like the above is brutally reduced, it’s almost trivial even, and I’m hopeful with the prospects of democratizing profiling like this. At the very least, I can say that this is a massive improvement to desktop developers.


Leave a Reply