
Last year the Webkit project started to integrate its tracing routines with Sysprof. Since then, the feedback I’ve received about it is that it was a pretty big improvement in the development of the engine! Yay.
People started using Sysprof to have insights about the internal states of Webkit, gather data on how long different operations took, and more. Eventually we started hitting some limitations in Sysprof, mostly in the UI itself, such as lack of correlational and visualization features.
Earlier this year a rather interesting enhancement in Sysprof was added: it is now possible to filter the callgraph based on marks. What it means in practice is, it’s now possible to get statistically relevant data about what’s being executed during specific operations of the app.
In parallel to WebKit, recently Mesa merged a patch that integrates Mesa’s tracing routines with Sysprof. This brought data from yet another layer of the stack, and it truly enriches the profiling we can do on apps. We now have marks from the DRM vblank event, the compositor, GTK rendering, WebKit, Mesa, back to GTK, back to the compositor, and finally the composited frame submitted to the kernel. A truly full stack view of everything.
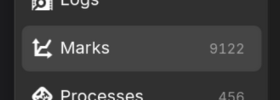
So, what’s the catch here? Well, if you’re an attentive reader, you may have noticed that the marks counter went from this last year:
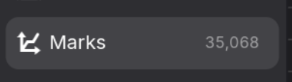
To this, in March 2025:
And now, we’re at this number:
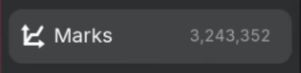
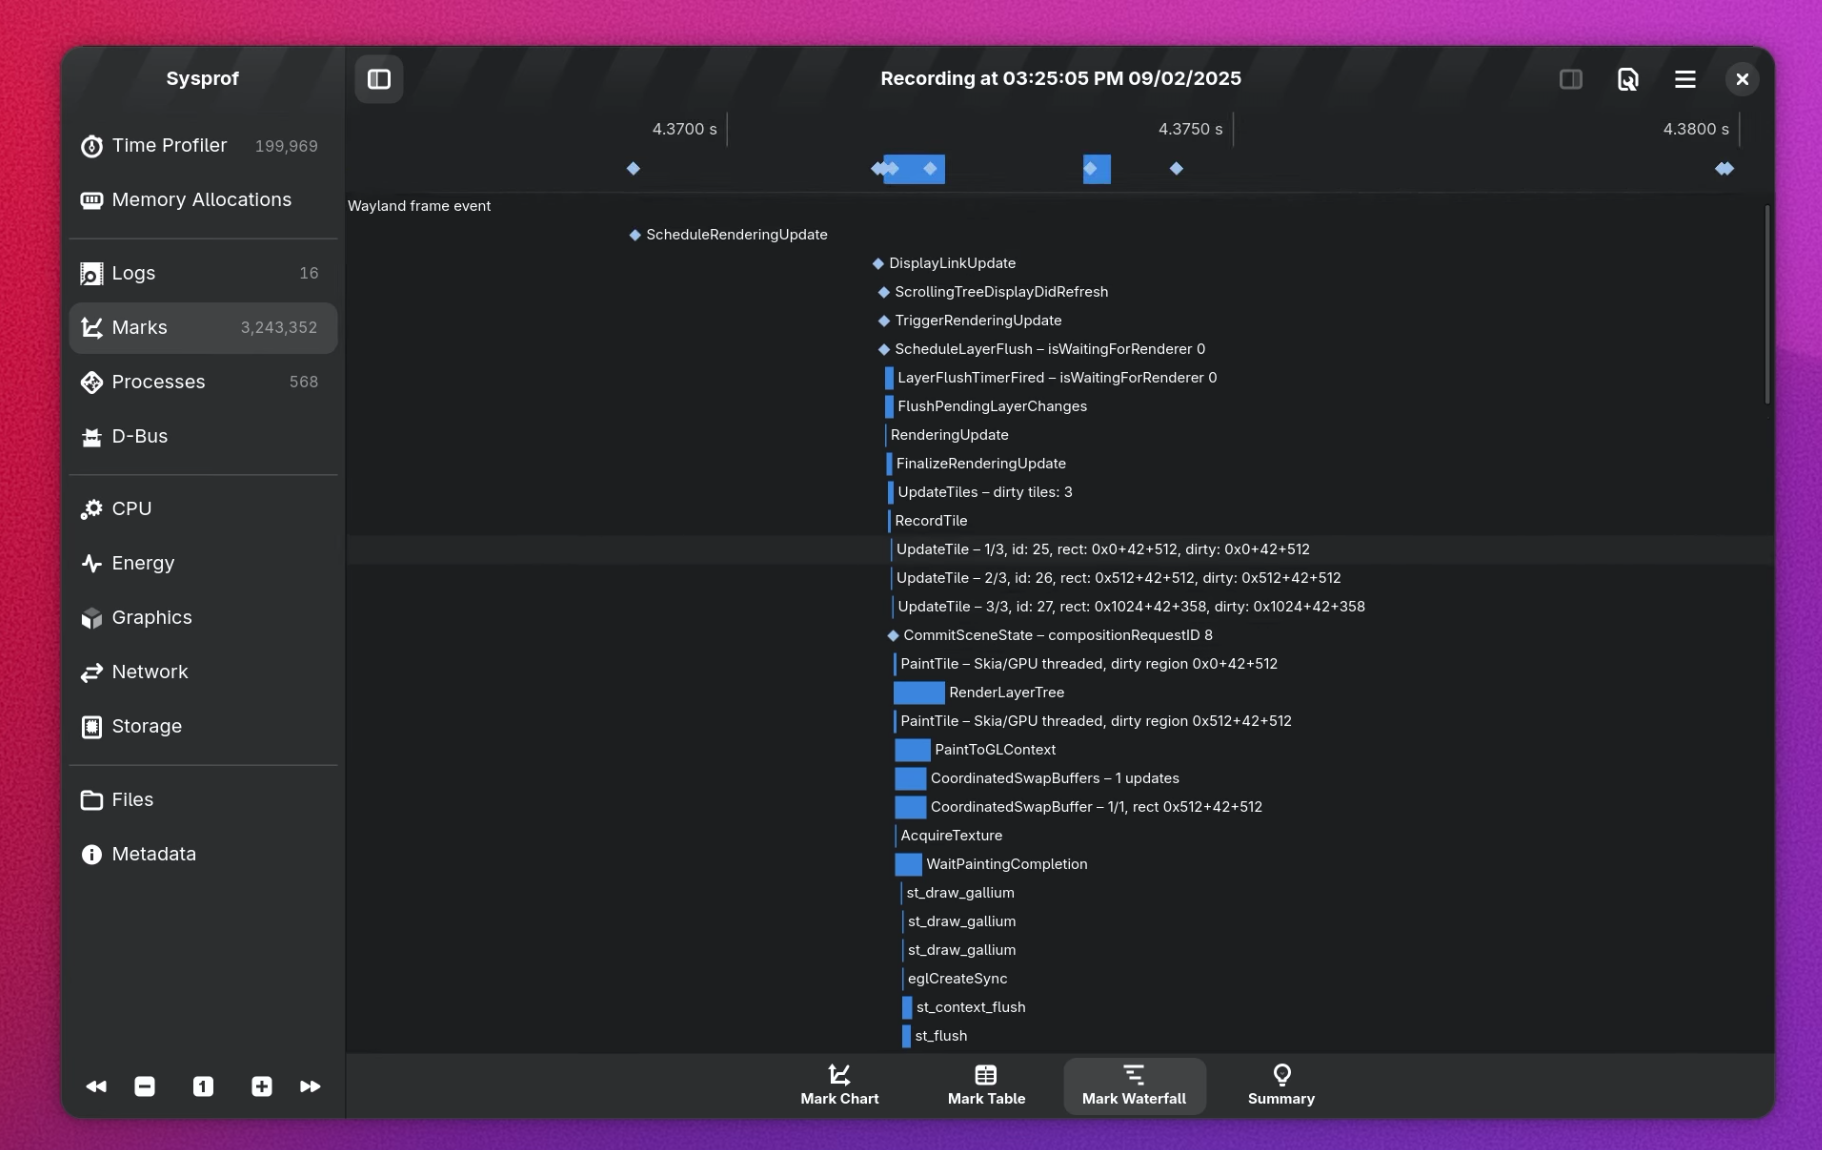
I do not jest when I say that this is a significant number! I mean, just look at this screenshot of a full view of marks:
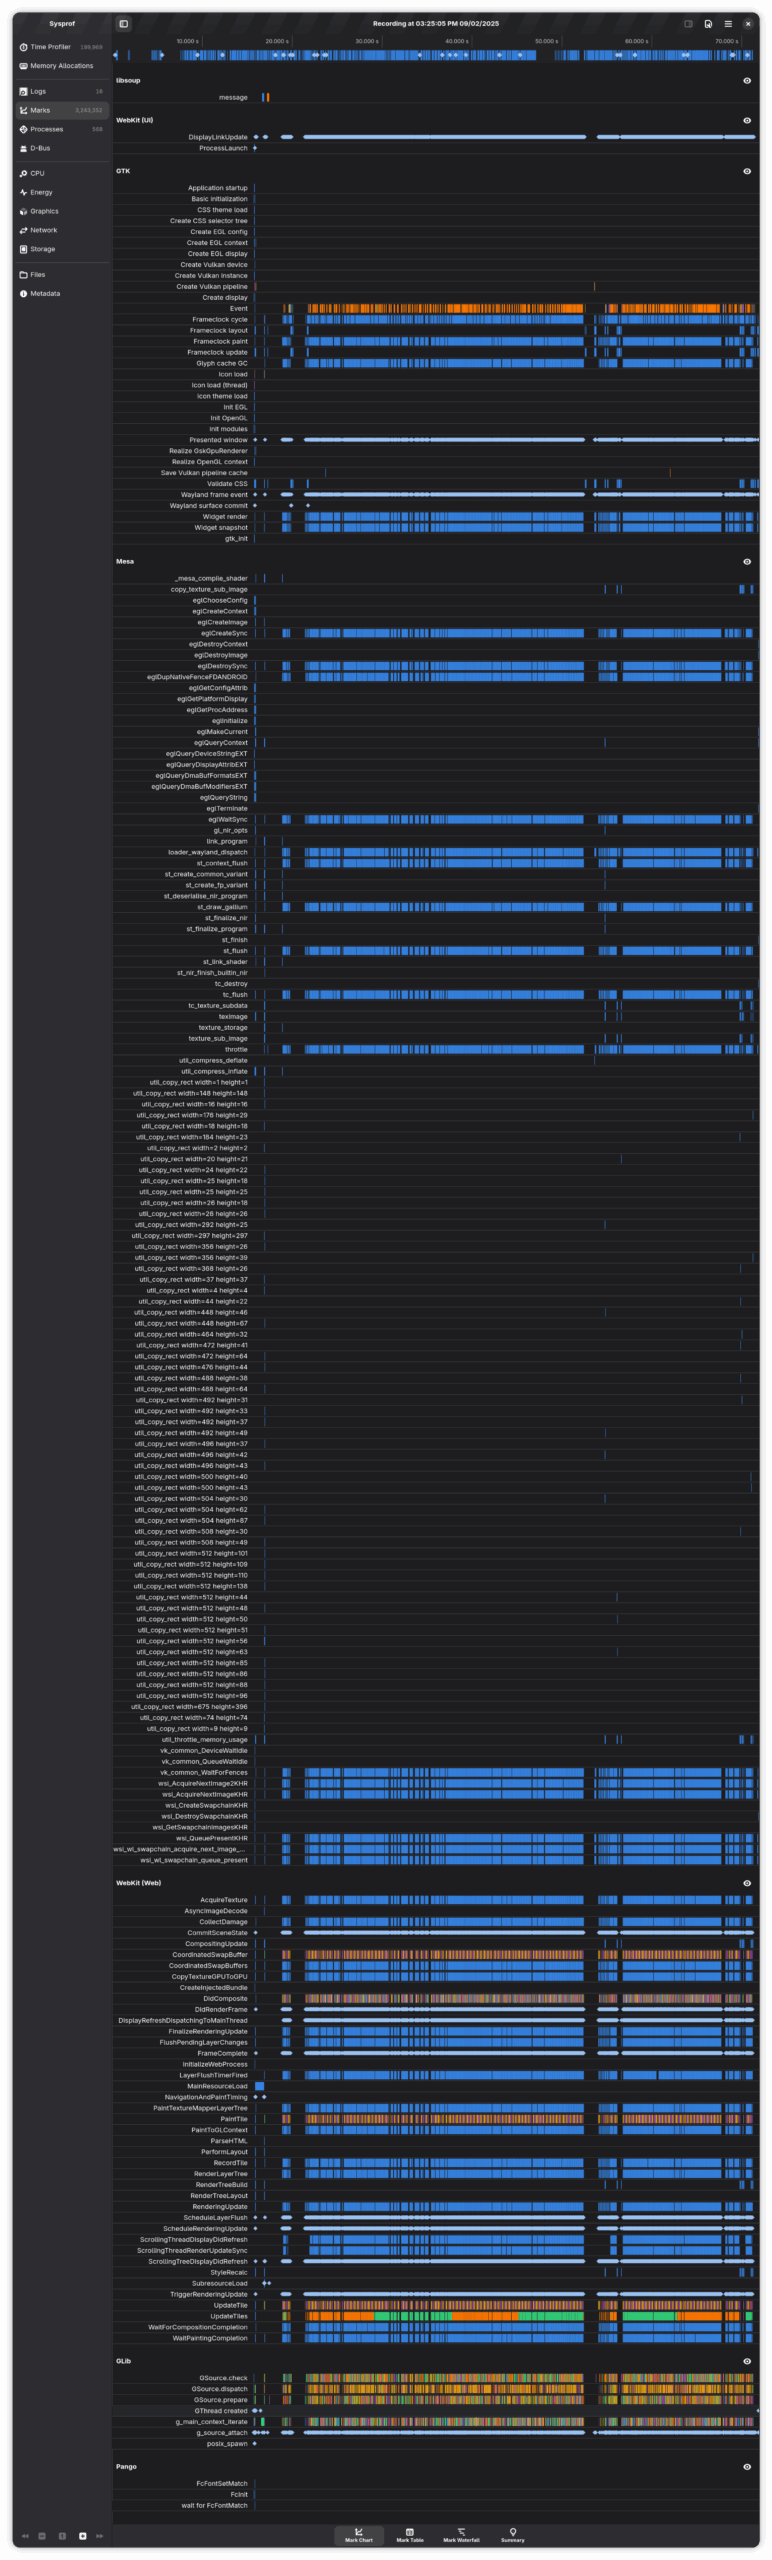
Naturally, this is pushing Sysprof to its limits! The app is starting to struggle to handle such massive amounts of data. Having so much data also starts introducing noise in the marks – sometimes, for example, you don’t care about the Mesa marks, or the WebKit marks, of the GLib marks.
Hiding Marks
The most straightforward and impactful improvement that could be done, in light of what was explained above, was adding a way to hide certain marks and groups.
Sysprof heavily uses GListModels, as is trendy in GTK4 apps, so marks, catalogs, and groups are all considered lists containing lists containing items. So it felt natural to wrap these items in a new object with a visible property, and filter by this property, pretty straightforward.
Except it was not 🙂
Turns out, the filtering infrastructure in GTK4 did not support monitoring items for property changes. After talking to GTK developers, I learned that this was just a missing feature that nobody got to implementing. Sounded like a great opportunity to enhance the toolkit!
It took some wrestling, but it worked, the reviews were fantastic and now GtkFilterListModel has a new watch-items property. It only works when the the filter supports monitoring, so unfortunately GtkCustomFilter doesn’t work here. The implementation is not exactly perfect, so further enhancements are always appreciated.
So behold! Sysprof can now filter marks out of the waterfall view:
Counters
Another area where we have lots of potential is counters. Sysprof supports tracking variables over time. This is super useful when you want to monitor, for example, CPU usage, I/O, network, and more.
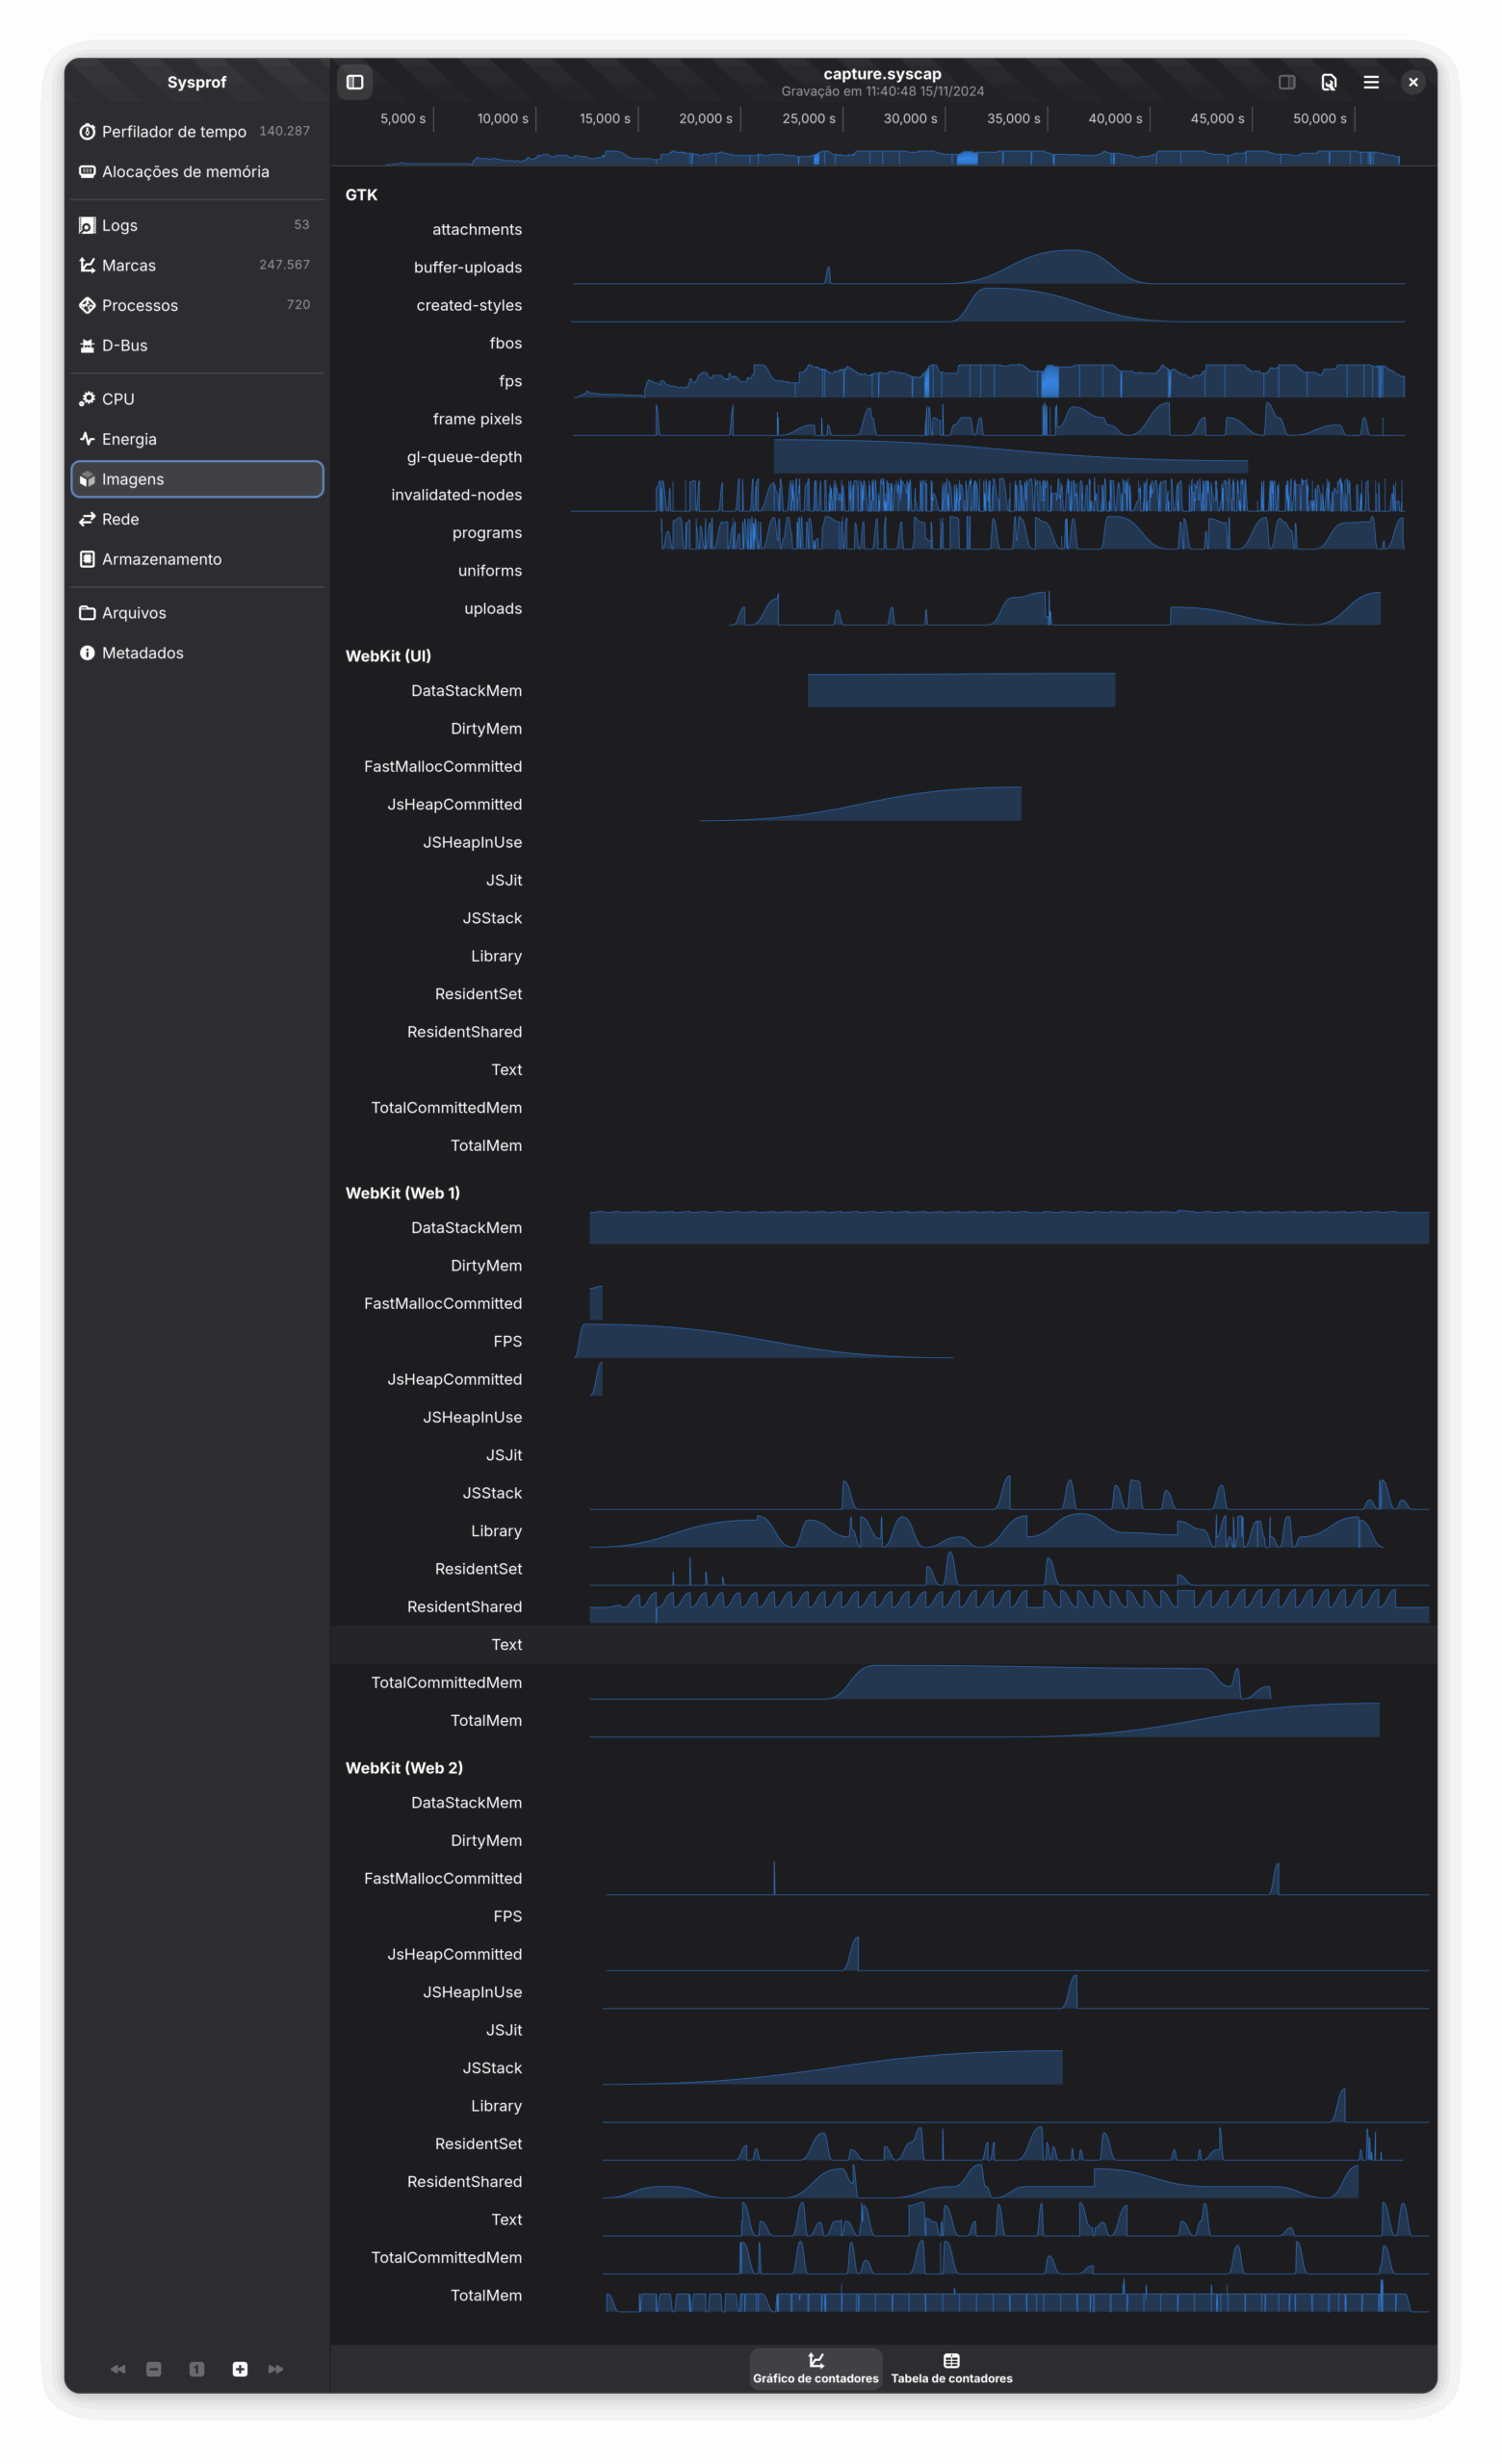
Naturally, WebKit has quite a number of internal counters that would be lovely to have in Sysprof to do proper integrated analysis. So between last year and this year, that’s what I’ve worked on as well! Have a look:
Unfortunately it took a long time to land some of these contributions, because Sysprof seemed to be behaving erratically with counters. After months fighting with it, I eventually figured out what was going on with the counters, and wrote the patch with probably my biggest commit message this year (beat only by few others, including a literal poem.)
Wkrictl
WebKit also has a remote inspector, which has stats on JavaScript objects and whatnot. It needs to be enabled at build time, but it’s super useful when testing on embedded devices.
I’ve started working on a way to extract this data from the remote inspector, and stuff this data into Sysprof as marks and counters. It’s called wkrict. Have a look:
This is far from finished, but I hope to be able to integrate this when it’s more concrete and well developed.
Future Improvements
Over the course of an year, the WebKit project went from nothing to deep integration with Sysprof, and more recently this evolved into actual tooling built around this integration. This is awesome, and has helped my colleagues and other contributors to contribute to the project in ways it simply wasn’t possible before.
There’s still *a lot* of work to do though, and it’s often the kind of work that will benefit everyone using Sysprof, not only WebKit. Here are a few examples:
- Integrate JITDump symbol resolution, which allows profiling the JavaScript running on webpages. There’s ongoing work on this, but needs to be finished.
- Per-PID marks and counters. Turns out, WebKit uses a multi-process architecture, so it would be better to redesign the marks and counters views to organize things by PID first, then groups, then catalogs.
- A new timeline view. This is strictly speaking a condensed waterfall view, but it makes it more obvious the relationship between “inner” and “outer” marks.
- Performance tuning in Sysprof and GTK. We’re dealing with orders of magnitude more data than we used to, and the app is starting to struggle to keep up with it.
Some of these tasks involve new user interfaces, so it would be absolutely lovely if Sysprof could get some design love from the design team. If anyone from the design team is reading this, we’d love to have your help 🙂
Finally, after all this Sysprof work, Christian kindly offered me to help co-maintain the project, which I accepted. I don’t know how much time and energy I’ll be able to dedicate, but I’ll try and help however I can!
I’d like to thank Christian Hergert, Benjamin Otte, and Matthias Clasen for all the code reviews, for all the discussions and patience during the influx of patches.
Leave a Reply to Georges Stavracas Cancel reply